Before writing a program, we must decide what it should do, in which order, and how it should react to different situations. A flowchart represents that plan graphically, using conventional symbols and arrows to show the path of execution.
NIST defines an algorithm as a clearly specified mathematical process or a set of rules that produces a prescribed result when followed. A flowchart is not the algorithm itself; it is one way to describe, inspect and communicate the algorithm before implementing it in a programming language.
What is a flowchart?
The definition associated with ISO 5807 describes a flowchart as a graphical representation of the definition, analysis or method of solving a problem, where symbols represent operations, data, flow and related functions. ISO 5807 provides symbols and conventions for program, data and system flowcharts.
A useful chart answers at least four questions:
- where the procedure starts and ends;
- which data enter and which results leave;
- which processing steps are performed;
- which path is chosen when a condition is true or false.
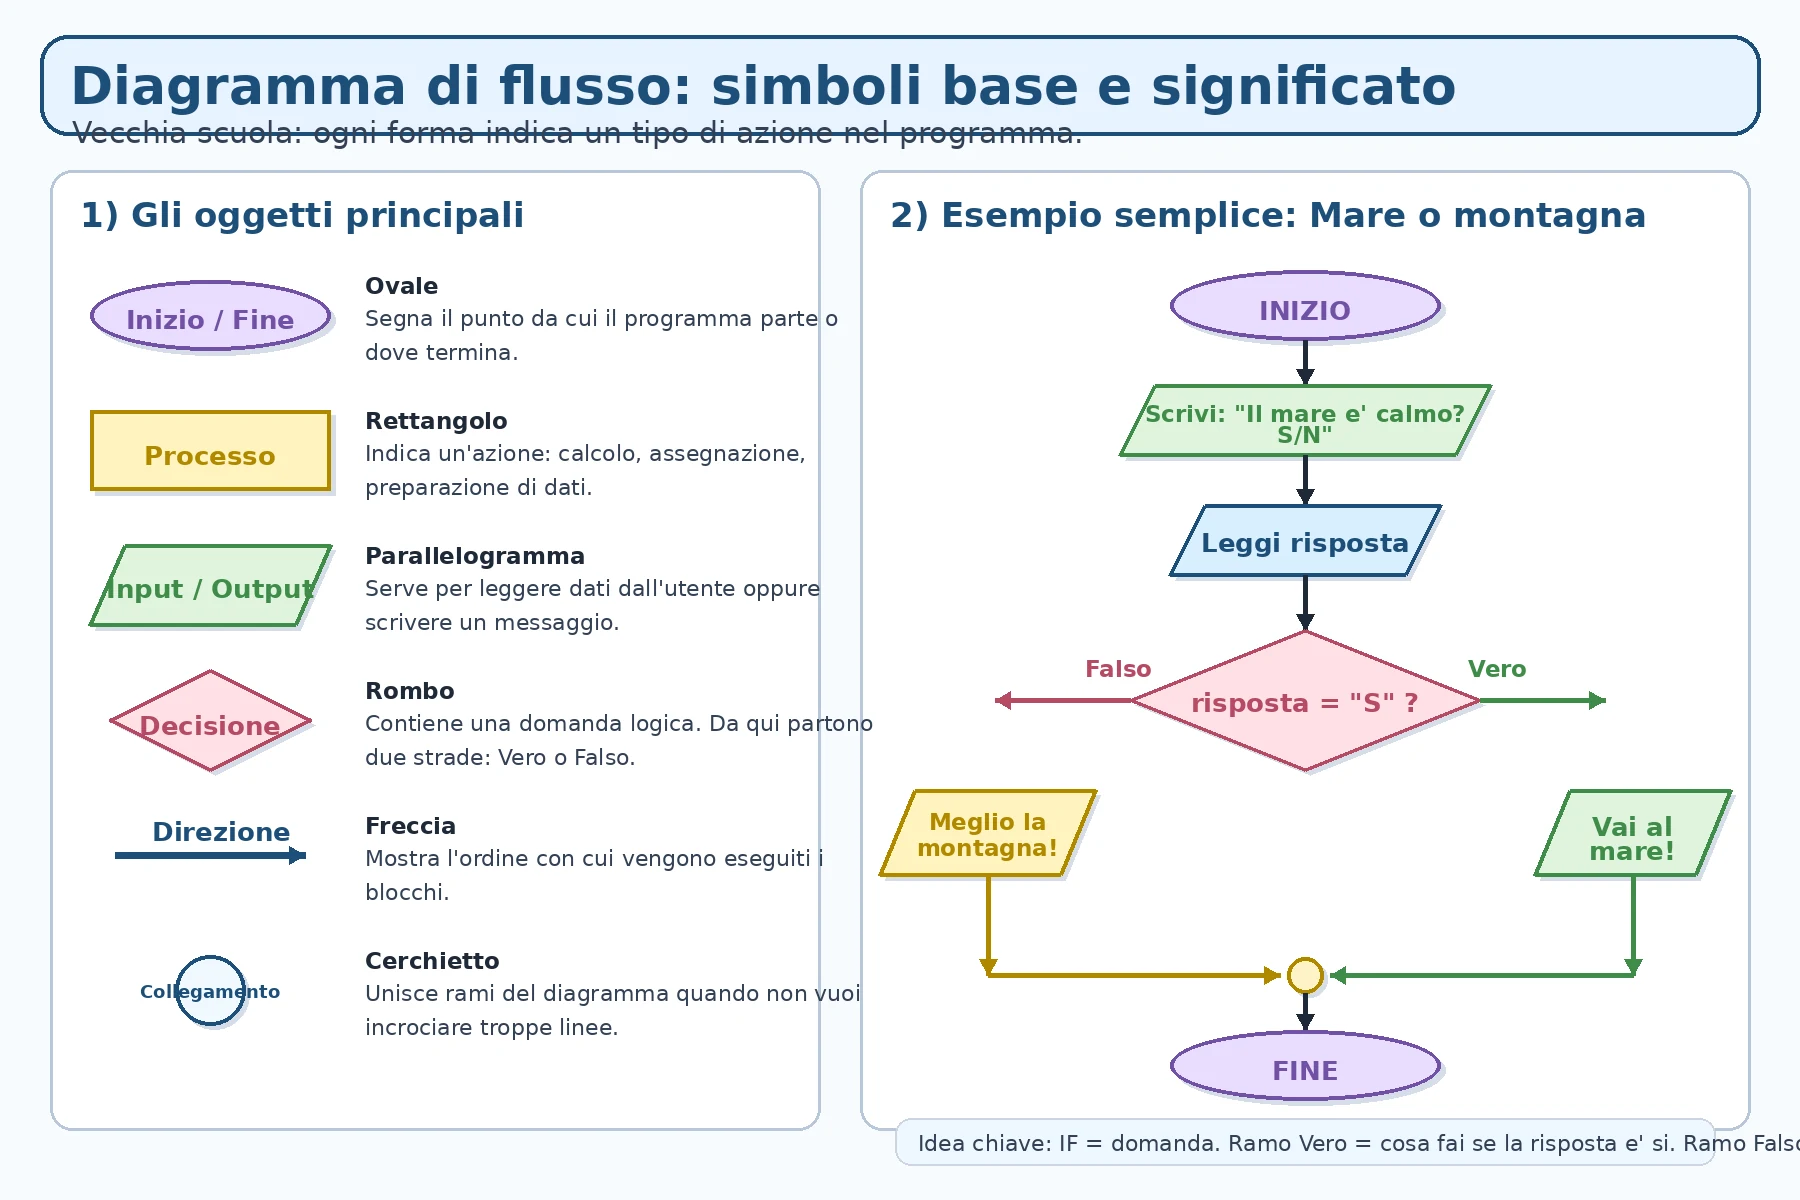 Terminals, process boxes, input/output parallelograms, decisions, arrows and connectors form the basic visual vocabulary of flowcharts.
The fundamental symbols
Oval or terminal: start and end
A terminal marks the beginning or conclusion of a procedure. A chart should have a clearly recognisable start and at least one final exit. In Flowgorithm, the initial terminal of the main function is normally labelled Main, whereas traditional diagrams often use “Start” and “End”.
Rectangle: process
A rectangle contains an internal action such as a calculation, assignment or data transformation:
total = number1 + number2 counter = counter + 1 final_price = price * 1.22A process changes the state of the problem without necessarily acquiring new data from the user.
Parallelogram: input and output
The parallelogram represents data entering or leaving the procedure. Input may come from a keyboard, sensor, file or another source; output may be displayed, stored or transmitted.
Read age Write "You are an adult"The same general shape is commonly used for both directions, so the wording inside it must make the action clear.
Diamond: decision
A diamond contains a condition evaluated as true or false. Two clearly labelled branches normally leave the shape:
age >= 18? answer == "Y"? number % 2 == 0?The decision does not execute both paths. It selects one according to the logical result.
Arrows: direction of control
Arrowed lines show execution order. Without arrowheads, the geometry can be ambiguous. Clear diagrams normally flow from top to bottom or left to right and avoid unnecessary crossings.
Connectors: continuing without a tangle
A connector lets a path stop and resume elsewhere, avoiding long or crossing lines. Matching connectors must use the same label. They improve some diagrams, but excessive use makes the flow harder to follow.
Reading the “sea or mountain” example
- the procedure starts;
- a question is displayed;
- the user enters an answer;
- the diamond checks whether the answer equals “Y”;
- the true branch displays “Go to the sea!”;
- the false branch displays “The mountains are better!”;
- the branches rejoin and the procedure ends.
The important idea is not the holiday choice but the structure: an initial sequence, a decision, two alternatives and a common continuation.
From the diagram to pseudocode
START WRITE "Is the sea calm? Y/N" READ answer IF answer = "Y" THEN WRITE "Go to the sea!" ELSE WRITE "The mountains are better!" END IF ENDPseudocode preserves the algorithmic structure while using organised statements instead of shapes. It is often the most convenient bridge between a drawing and source code.
From the diagram to Python
The official Python reference describes if, while and for as traditional control-flow constructs. The example becomes:
answer = input("Is the sea calm? Y/N: ").strip().upper() if answer == "Y": print("Go to the sea!") else: print("The mountains are better!")The oval is not a Python instruction: execution starts at the beginning of the program and ends when the code completes. Input becomes input(), output becomes print(), and the decision becomes if ... else. Indentation identifies the instructions belonging to each branch.
The three fundamental programming structures
Sequence
Instructions run one after another:
Read base Read height area = base * height / 2 Write areaSelection
A condition selects a path:
IF mark >= 6 Write "Passed" ELSE Write "Needs recovery"Iteration or loop
A flow line returns to an earlier condition and repeats part of the chart:
counter = 1 WHILE counter <= 5 Write counter counter = counter + 1 END WHILEThe returning arrow makes repetition explicit rather than suggesting a one-time sequence.
Designing a correct loop
A well-formed loop needs:
- initialisation;
- a continuation or exit condition;
- the repeated body;
- an update that moves execution towards termination.
Without an update, the diagram may describe an infinite loop. A wrong condition may skip the body completely or execute it one time too many.
Flowgorithm: executable flowcharts
Flowgorithm presents itself as a free beginner's programming language based on graphical flowcharts. Unlike a static drawing, it allows declarations, assignments, input, output, decisions, loops and functions to be entered and executed.
The official tutorial introduces the rounded terminals of the main function. Template documentation lists assignment, call, declaration, If, While, For, input and output. The Source Code Viewer can translate a chart into several programming languages and visually relate each shape to generated code.
This does not mean generated code should be copied blindly. The educational value lies in understanding the correspondence between visual structure and textual structure.
Are flowcharts “old school”?
They predate modern development environments, but they are not therefore useless. ISO 5807 remains a published and confirmed international standard, and current ISO drafting directives still refer to it for flowcharts in technical documentation.
Flowcharts remain useful for:
- teaching sequence, selection and iteration;
- explaining a procedure to people with different backgrounds;
- analysing a problem before choosing a language;
- documenting short or critical processes;
- finding missing branches and unclear conditions;
- comparing an algorithm with its implementation.
They become less effective for extremely large programs, complex concurrency, hundreds of exceptions or dense networks of lines. Pseudocode, UML diagrams, decision tables, state machines or code-linked documentation may then work better.
Good practices for readable charts
- give the chart a descriptive title;
- keep the main flow top-to-bottom;
- write short actions with one task per block;
- express decisions as testable questions;
- label true/false or yes/no branches;
- avoid unnecessary crossings and diagonal lines;
- use connectors only when they improve readability;
- test every path, not only the expected one;
- use consistent variable names;
- update the chart when the program changes.
A practical path from problem to algorithm
- define the goal: what result is required?
- list the inputs: which data are needed?
- define the outputs: what should the user receive?
- identify cases: which conditions change the path?
- identify repetition: which actions must loop?
- draw the flow: use consistent symbols and clear arrows;
- simulate it manually: try ordinary, boundary and invalid data;
- translate it into code: preserve the same logic;
- test it: compare actual and expected results.
Common mistakes
- Putting a question in a process box: logical conditions belong in a diamond.
- Not labelling branches: the reader cannot distinguish true and false.
- Drawing lines without direction: execution order becomes ambiguous.
- Creating a loop without an update: it may never terminate.
- Confusing input and processing: reading a value is not calculating it.
- Placing too many actions in one block: the chart loses precision.
- Letting documentation become stale: an outdated chart no longer describes the program.
Frequently asked questions
Is a flowchart a program?
Usually it is a representation of an algorithm. In tools such as Flowgorithm, however, the shapes contain executable statements and form a visual program.
Should every decision have two exits?
A Boolean decision normally has two outcomes, and both should be represented even when one immediately continues or terminates.
Is the parallelogram used for both input and output?
Yes, in the common convention. The verb inside the shape clarifies the direction of the data.
Can a chart be translated automatically into Python?
Flowgorithm has a source-code viewer for several languages. The result must still be read and tested; understanding the algorithm remains essential.
When is pseudocode better?
When an algorithm is long, deeply nested or frequently edited. Pseudocode takes less space and stays closer to source code.
Official sources and further reading
- NIST - definition of algorithm
- ISO 5807 - flowchart symbols and conventions
- ISO - definition of flowchart
- Flowgorithm - official website
- Flowgorithm - official tutorial
- Flowgorithm - Source Code Viewer and features
- Flowgorithm - available statements and templates
- Python - compound statements and control flow
- Python - official control-flow tutorial